Script Debug Overlay#
To better visualize errors and performance of your script, you can turn on Script Debug Overlay, which enables an in-game HUD overlay, showing all script instances that are currently executed.
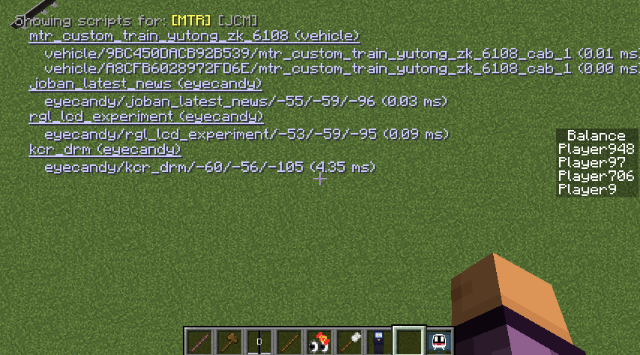
Enable the overlay#
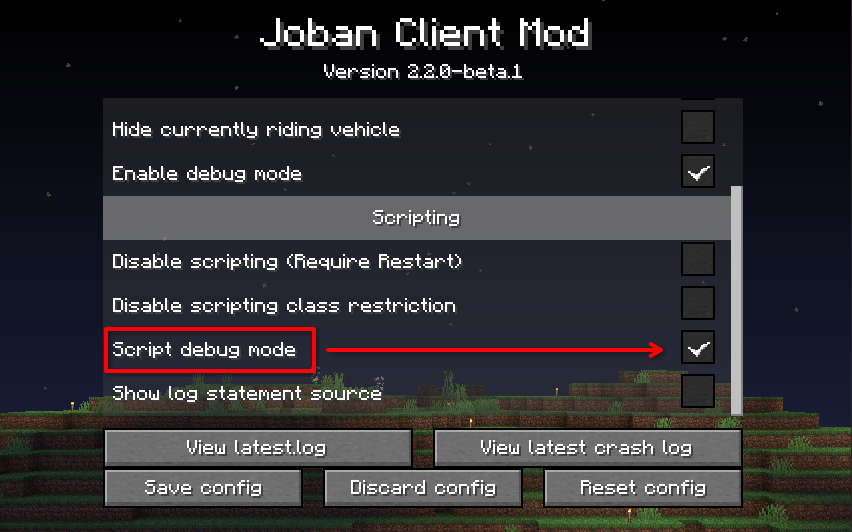
Go to Mod Menu / Mod Config Screen (Forge), find JCM and click on Configure.
After that, make sure the Script debug mode checkbox is checked, then click Save Config.
How to read the overlay#
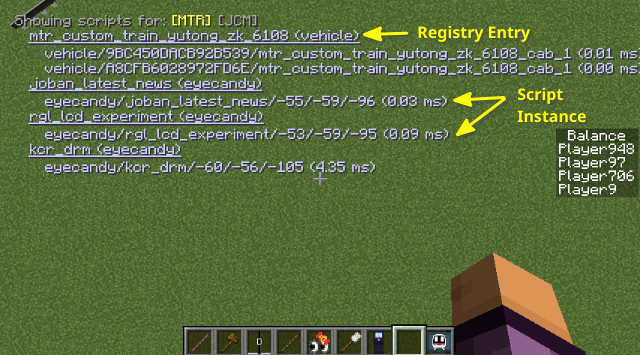
- For each underlined text, it represents a registry entry of the script. The type of scripts are appended after the text (e.g.
(eyecandy))- For each indented items, it represents an instance of the script. Note that these instances are "virtual", as in there's still only a single instance of your script, but to keep track of the state variables and draw calls, JCM uses a concept called instance to associate data for each uniquely identifiable script objects in the world, and invoke the
render()function with values from different instances. - There are 3 colors for each instances: Blue (Normal), Yellow (Slightly slow execution) and Red (Relatively slow execution).
- Script developers should generally aim for the Blue color if possible.
- For each indented items, it represents an instance of the script. Note that these instances are "virtual", as in there's still only a single instance of your script, but to keep track of the state variables and draw calls, JCM uses a concept called instance to associate data for each uniquely identifiable script objects in the world, and invoke the
Navigate between sources#
Since mixing all script instances into 1 view would clutter up the overlay, the overlay are separated by different "source". For instance, it will only show scripts coming from [MTR] (Vehicle/Eyecandy Scripting), and [JCM] (PIDS Scripting).
You can press [ and ] on your keyboard to select between them, they are also configurable in keybind settings in-case a conflict occurs.